Fed Policy Fuels Dot-Com-Like Speculative Bubble
Bank of America warns clients to take profits as market warning signs flash red. Fed monetary policy and deficit spending helped inflate a speculative bubble echoing the 2000 dot-com crash.
Bank of America advised clients Friday to "take profits" as seven of its ten bear-market warning signs flash red, matching the average threshold crossed before downturns since 1990. Federal Reserve monetary policy helped inflate a speculative asset bubble that echoes the 2000 dot-com crash. The central bank's next decision may burst it.
"There are too many red flags. Take profits," said Savita Subramanian, head of U.S. equity and quantitative strategy at Bank of America. Her team found the S&P 500 trades richer than during the dot-com bubble on eight of twenty valuation metrics. The bank set a year-end target of 7,100, implying 6 percent downside from current levels.
The tech sector shows dispersion between best and worst-performing quintiles hitting 120 percentage points, the widest gap since February 2000 when it reached 130 points before the March 24 peak. Median stocks in the top tech quintile gained 110 percent over three months, while similar dot-com stocks gained 120 percent before their collapse. The Buffett Indicator measuring market cap to GDP stands at 230.3 percent, above the 148 percent dot-com peak. The Shiller CAPE ratio hovers near 39, second-highest in history behind the 2000 peak of 44.2.
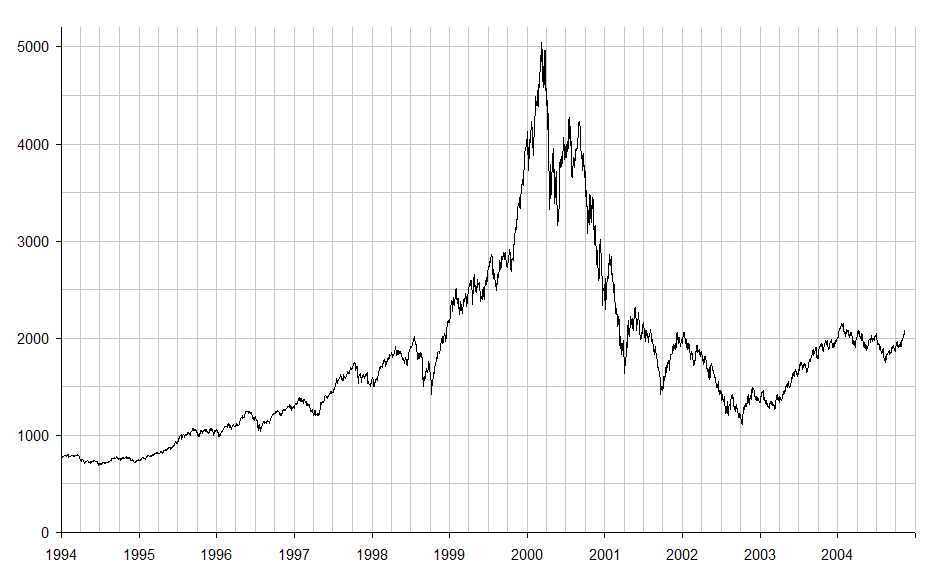
May's jobs report triggered the reckoning. Nonfarm payrolls of 172,000 crushed the 80,000 estimate and revived fears of Fed rate hikes. The Nasdaq dropped 4.2 percent on June 5, its worst session since April 2025. The Philadelphia Semiconductor Index plunged over 10 percent, its fourth-worst decline since 1994. The Dow fell nearly 700 points.
Higher discount rates mechanically compress valuations on growth stocks whose value depends on future earnings. The selloff exposed how artificial stimulus inflated prices beyond fundamentals. Ray Dalio, Bridgewater Associates founder, told Bloomberg Television on June 3 that markets are "rising close to—not at—the same level in 2000 and the same level in 1929."
Dalio described U.S. debt service as "plaque in the circulatory system, squeezing out the flow of blood." He warned the Fed will face a "severe test from the bond market" and noted that "all great technology changes produce bubbles." The government spends about $7 trillion annually against $5 trillion in revenue, Dalio said. JPMorgan CEO Jamie Dimon called deficit spending a "sugar high" for corporate profits.
"It's gung-ho, folks," Dimon said at Bernstein's Strategic Decisions Conference on May 27. He referenced 1972, 1986, 2000 and 2007 as periods of similar exuberance before trouble. Dimon flagged $10 trillion to $12 trillion in deficit spending over six or seven years that "fuels corporate profits" through government borrowing.
The semiconductor selloff illustrates the market's addiction to continuous acceleration. Broadcom reported extraordinary second-quarter results on June 3, with revenue of $22.19 billion up 48 percent year-over-year and AI revenue surging 143 percent to $10.8 billion. Yet its third-quarter AI guidance of $16 billion missed the $17.2 billion consensus. Shares fell 14 percent.
AMD dropped 11 percent, Intel fell 11 percent and Micron plunged 13.3 percent. More than $1 trillion in semiconductor valuations evaporated since the sector peaked June 2. Beating present expectations while holding future forecasts steady registered as a miss.
Hyperscaler AI capital expenditure projections reveal structural distortion. Spending will reach $650 billion to $739 billion in 2026, up 78 percent from 2025's $416 billion. Capex-to-operating cash flow will approach 100 percent by year-end, up from 40 percent in 2023. Goldman Sachs estimates $7.6 trillion in AI capex through 2031.
Google issued $85 billion in new stock, while Meta considers similar moves. Hyperscaler debt supply reached $159 billion year-to-date. This trajectory mirrors telecom's 140 percent capex-to-cash-flow peak in 2001, which preceded massive industry write-downs and bankruptcies.
Market concentration amplifies systemic risk. The top 10 S&P 500 stocks now account for over 35 percent of index weight, with the Magnificent Seven alone at 30.44 percent — the highest concentration in half a century. Financials, healthcare and consumer discretionary sectors recorded negative returns year-to-date, showing the rally is narrow and artificial.
Analyst divergence reveals confusion about fundamentals. Bank of America's 7,100 target contrasts with Morgan Stanley's 8,000 and Citi's 8,100. "Today's optimism is yet another way in which 2026 is looking like 1999," said Owen Lamont, senior portfolio manager at Acadian Asset Management.
Oracle's earnings report on June 10 serves as the next flashpoint for whether this cycle reflects genuine enterprise demand or another leg of speculative mania. The Federal Reserve created conditions that free-market corrections would have prevented earlier. Now history's warning lights glow red.